Atlas Metrics is an ESG data infrastructure platform helping banks, funds, and businesses collect, analyze, and report non-financial data across complex regulatory frameworks like CSRD, SFDR, and the GHG Protocol.
The platform serves organizations navigating a landscape where compliance requirements evolve faster than most teams can keep up.
We turned a technically and regulatorily complex domain into something approachable, structured, and trustworthy, from the first data input to the final audit-ready report.
Lead / Founder Designer
Product Management
Web application (desktop)
Design system
Branding & visual language
Marketing website (Framer)
User research & customer interviews
Product roadmapping
Design process & team foundations
Accountability Effect. Atlas Metrics poster
A man at a laptop, surrounded by ESG topic tags: Energy, Workforce, Financials, Emissions, Water, Waste
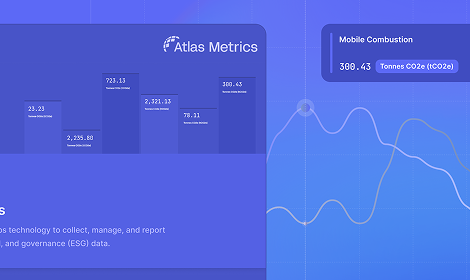
ESG Data Management & Reporting Combined, with emissions bars in tCO2e
Contributed to scaling Atlas from zero, growing ARR 139% a year. Atlas was acquired by Novata in 2026 to expand its reach across global private markets.
ESG reporting sits at the intersection of regulatory pressure, data fragmentation, and organizational complexity. Most companies deal with:
Most existing solutions were built for compliance departments, not for the people actually doing the work. The result: tools that were rigid, slow, and disconnected from real workflows.
We shaped a platform that turns regulatory complexity into a clear, guided workflow, one that could serve a sustainability manager at a mid-size company and a risk analyst at a major bank within the same system. As the founding designer, the role extended beyond craft: contributing to roadmap decisions, shaping product priorities, and establishing the design processes that would support a growing team.
Built from 187 components, with variants, dropdown states and toggles for flexible builds. Tokens for color, text style, radius and spacing.
Atlas design system components
Shaping roadmap decisions, product priorities, and the design processes that would scale with the team.
The team docs stacked: Design to code: Terra Nova, Design Progress, Design handover guide and Impact & UX analytics
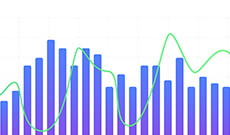
Complex metrics legible without oversimplifying. Clear data tables, comprehensive graphs and statuses you can read at a glance.
Trust and precision, critical for a compliance-adjacent product.
Rather than a single feature, Atlas was built as a connected suite. Each chapter solves a distinct problem in the ESG data journey.
Video: Data library demo: filtering by fund, searching, opening a flagged data point, then confirming, correcting and notifying in the Quality check tab
The result. The quality check lives inside the Data library, as a tab next to every data point. Filter by fund, search, open a value to see its history and source, then confirm, correct or ask the company, without leaving the library.Sticky-note scoping board: which data types are considered, what GPs want, and which classes of issue exist
Scope. Starting with the questions before any screens: which data types a check should cover, what counts as an issue, and what a GP actually wants to do about it.Swimlane journey across KfW, the GP and the portfolio company, from the quality run to republished data
Map the journey. Following one flag from the LP’s quality run, through the GP resolving it, to the portfolio company republishing, with the open questions marked along the way.Decision tree from the GP to GP-level, fund-level and portfolio company metrics, each branching into critical values, errors and omissions
Data information structure. Splitting every flag by level (GP, fund, portfolio company) and by type (critical value, error or outlier, omission), with thresholds deciding when a company is told.Wireframe of GP, fund and portfolio company tables with Confirm, Resolve and Inform actions, statuses and notes on submitting
Wireframe. One table per level, with Confirm, Resolve and Inform on every row and a status that follows the flag until the GP submits.Video: Formula editor demo: typing a function, searching inputs with a details preview, inserting them as chips, validating, switching to Expression and creating the metric
The result. A formula editor that searches as you type. Inputs and recipes come up with their URN, units and where they are already used, drop in as chips, and the formula validates before you save. Expression view shows exactly what the parser gets.Interview quotes from ESG analysts about writing formulas, and a table of user roles and their needs
Listen. Interviews with the ESG analysts who write the formulas: finding the right indicator was manual, recipes were hard to reuse, and nothing autocompleted or validated.The old CMS metrics table with thousands of rows, annotated with sticky notes about raw SQL formulas and lookups in other tabs
What it was. Thousands of metrics in a generic CMS table, formulas typed as raw SQL, and lookups done in a spreadsheet next to it.User flow: entry points into the formula editor, choosing to reuse or start a recipe, and the create metric steps from details to recipe
Map the flow. Four ways into the same formula field, reuse or start fresh, and where the editor sits inside creating a metric.Formula editor states: search while typing with a details panel, the formula in plain text and in expression form, and the chip colour legend
Design the states. Search while typing with a details preview, and the same formula as readable chips or as the raw expression, with one colour per kind of entity.Video: Carbon accounting demo: scope breakdown by business unit, a reduction measure whose emissions pathway updates live against the 2030 target, and financed emissions by PCAF data-quality score with the detailed summary table
The result. One module from footprint to plan. Break emissions down by scope and business unit, model a reduction measure and watch its pathway move against the 2030 target as you change the numbers, then report financed emissions under PCAF with the data quality behind every figure.Flow from dashboard to setting up the org tree, collecting carbon data and seeing the report, with sticky notes on what users can and cannot do at each step
Map the module. Business units were new to carbon accounting, so each step got its rules first: what a user can and can’t do with the org tree, the data collection and the report.The add measure modal with time horizon and simulated values, next to two iterations of the add measure popover
Design the measure. A measure picks a time horizon and changes the activity data per country, department or branch. The popover iterations settled how to choose between a ready-made and a custom measure.Spec for reducing or increasing all values by a percentage, with a note on choosing which inputs the percentage applies to
Spec the shortcuts. Editing hundreds of values one by one doesn’t scale, so a measure can reduce or increase them all by a percentage, scoped to the inputs it should touch.PCAF summary: financed emissions per asset class split by data-quality score, and a detailed summary table flagging missing inputs
Financed emissions. PCAF results per asset class, split by data-quality score so a bank sees how much of a number is estimated, with the summary table flagging missing or inconsistent inputs.Video: Risk engine demo: counterparties counted by risk level and sorted by average risk, a company risk profile, and physical risk where switching the climate scenario and year updates each hazard and its mitigation measures
The result. From portfolio to a single site. Counterparties are counted by risk level and sorted by what needs attention, each company gets a profile across five risk types, and physical risk updates live as you switch the climate scenario or the year, with mitigation measures only where a hazard is high.Spec for the physical risk dashboard: level 1 scope, score, summary, and year and scenario drop-downs
Spec the dashboard. What every element means and how it aggregates across years, scenarios and locations, starting from what the data could support: level 1, three hazards.Flow for GPT-based reputational reassessments with open questions on data storage, combining outputs and visualisation
Design the reassessment. Reputational risk is reassessed on a schedule from the latest news articles about the company. Mapping the flow surfaced the real questions: what to store, how to weigh old against new, and how to show a change.Estimation board with work packages, assumptions and FTE-day estimates, summing to 23 to 41 days, or 18 with scope reduction
Estimate and cut. Sizing every work package with engineering, then trimming scope to land the first release at 18 FTE days instead of up to 41.Annotated design review of the risks overview with content, accessibility, UI and interaction fixes
Review and refine. A pass over the shipped overview: count companies instead of revenue, accessible colours, sortable risk and shorter numbers.Video: Double materiality demo: putting an ESRS topic in scope, scoring an impact on four criteria until it crosses the threshold, then the materiality matrix where dragging the impact threshold changes which topics are material
The result. A double materiality assessment people can actually finish. Pick the ESRS topics in scope, score each impact, risk and opportunity on four criteria and see it cross the threshold, then read the matrix and move the threshold to see which topics become material.The Conduct DMA step from the customer journey map in Miro, for a sustainability officer, a sustainability team lead and a data contributor: actions, needs and pains, touchpoints and feelings on sticky notes
Who runs the DMA. From the journey map: a sustainability officer picking it up whenever time allows, a team lead running stakeholder workshops and chasing survey results, and colleagues who feel it is extra work and don't see how it shapes strategy.Flow from select topics to identify IROs per topic, score IROs and see what is material, with sticky notes on rules, UX behaviour, thresholds and stakeholder feedback
Topic, then IRO, then material. The challenge in one line: select your topics, score the impacts, risks and opportunities under each one, and know what is material for you. The notes hold the rules we agreed on and the feedback that came in.Stakeholder feedback from Slack next to the new Manage IROs design, where each topic expands into its IROs with specifications, a score and a score button
Into Atlas, with feedback. Moving it into the product put topics and their IROs in one tree. Feedback came in early: a scored IRO is locked, templates must be editable, and the view needed filter, search and open or close all.Atlas grew from an early-stage product into a platform serving hundreds of organisations across banks, funds and portfolio companies. The gap between what the product did and what customers needed was absorbed by people: an in-house ESG consulting team who ran workshops, set up accounts, answered questions and did by hand whatever the app didn't do yet. It worked, but it didn't scale. Every new customer meant more consultant hours, and the team couldn't keep growing in step.
Atlas home with a What's next list
Part one Inside the app Research that reframed the problem, then a home, data collection and framework dashboards rebuilt around what to do next. Read case studyAtlas reports setup screen
Part two Outside the app Moving the new reporting year from consultants to customers: a contract model, an org tree and a self-serve setup flow. Read case studyBuilding Atlas from zero to acquisition meant designing through every stage of a product's life, from rough early concepts with no users to a mature platform trusted by financial institutions across 15+ countries.
The challenge was never any single feature. It was maintaining coherence, quality, and user trust across a product that kept expanding in every direction.
Zero users
No platform
Rough concepts
Mature platform
15+ countries
3000+ businesses
Acquired by Novata, 2026
Angelo Wellens, Product Designer
Builds from first idea to launched product